

Most ecommerce marketers running Meta and TikTok campaigns face the same quiet crisis: dozens of active ads, each generating data, and no reliable way to know which ones are actually doing the work. Knowing how to identify top performing ads is not about reading more dashboards. It is about knowing which numbers matter, in what order, and what they are actually telling you about your creative, your audience, and your offer. This guide walks you through the exact process, from setting up your metrics to scaling winners with confidence.
Table of Contents
- What you need: metrics, tools, and mindset to identify top-performing ads
- Step-by-step process to identify top-performing ads on Meta and TikTok
- Troubleshooting common pitfalls when identifying top ads
- Verifying success: expected results and optimization next steps
- Why focusing solely on ROAS is risky: a deeper approach to identifying top ads
- Optimize your ad creatives and performance with Creaboost
- Frequently asked questions
Key Takeaways
| Point | Details |
|---|---|
| Focus on ROAS first | ROAS is the primary metric to identify profitable ads before examining other factors. |
| Use a diagnostic mindset | Analyze metrics like CTR, CPA, frequency, and CPM together to understand ad performance fully. |
| Avoid early judgments | Allow ads to reach sufficient conversions and spend before concluding their effectiveness. |
| Watch for ad fatigue | Indicators like rising frequency above 2.5 and CPM with declining CTR signal audience fatigue requiring action. |
| Integrate tracking accuracy | Fix pixel and event tracking to ensure reliable data and better automation results on Meta. |
What you need: metrics, tools, and mindset to identify top-performing ads
Before you can start identifying successful ads, you need the right foundation. That means three things: the right metrics, reliable tracking, and a diagnostic way of reading data.
The core metrics for analyzing ad effectiveness
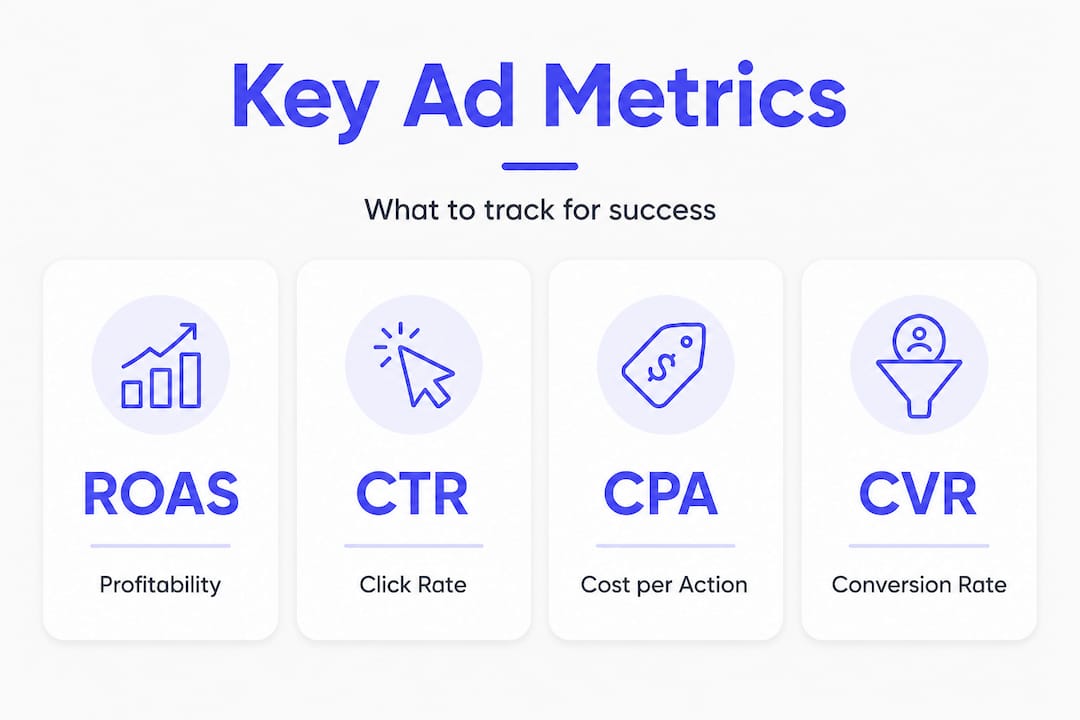
Not all metrics are created equal. Focus on CPM, CTR, CPA, and ROAS as your primary indicators of ad health. Here is what each one tells you:
- ROAS (return on ad spend): Revenue generated per dollar spent. Your clearest signal of profitability.
- CTR (click-through rate): The percentage of people who click after seeing your ad. A direct read on whether your hook and creative are compelling.
- CPA (cost per acquisition): How much you are paying per conversion. The metric that tells you whether an ad is profitable at your margin.
- CPM (cost per thousand impressions): What you are paying to reach 1,000 people. Rising CPM with flat CTR is a warning sign.
On TikTok, add Hook Rate to this list. Hook Rate measures the percentage of viewers who watch past the first two seconds. It tells you whether your opening frame is earning attention, which is everything on a platform built on scroll behavior.
Tracking integrity is non-negotiable
None of these metrics mean anything if your data is dirty. Fix your tracking setup first before drawing any conclusions from ROAS or CPA numbers on Meta. This means having both your Meta Pixel and Conversions API (CAPI) running simultaneously. CAPI server-side tracking recovers conversion signals that browser-based tracking misses, especially post-iOS 14. Without it, your reported ROAS can be significantly understated, and your automation is making decisions on incomplete data.
Tools that give you visibility
Meta's Ads Manager and TikTok Ads Manager are your starting points. Meta's Ad Library shows you what any advertiser is currently running, which helps when studying creative patterns across your vertical. For understanding building high-performing ads at the concept level, you also need a tagging system that goes beyond what the native platforms provide.

Pro Tip: The biggest data mistake most teams make is reading metrics in isolation. A high ROAS on an ad with low CTR might mean the ad is converting a very small, highly qualified audience. That is not scalable. Always read ROAS alongside CTR and CPM together.
| Metric | What it measures | Warning threshold |
|---|---|---|
| ROAS | Revenue per dollar spent | Below 2.0 for most ecommerce |
| CTR | Creative appeal and relevance | Below 1.0% |
| CPA | Conversion efficiency | Above your target acquisition cost |
| CPM | Audience saturation or competition | Rising without CTR growth |
| Frequency | How often the same person sees the ad | Above 2.5 signals fatigue risk |
Now that you understand the essentials, let's break down the exact process to identify top ads.
Step-by-step process to identify top-performing ads on Meta and TikTok
This is where most teams skip steps and pay for it later. A structured process for measuring ad campaign success produces consistently better results than ad hoc reviews.
Step 1: Define your north star metric
Choose one primary metric before you start pulling data. For most ecommerce brands, ROAS is the default. If you are in a tight-margin category, CPA might be more relevant. Why ad creatives drive ROAS on Meta and TikTok comes down to how well the creative selects and converts the right audience. Your north star metric focuses the analysis on what your business actually needs.
Step 2: Filter for statistical reliability
This is the step most teams skip. Sort ads by ROAS and exclude those with fewer than 50 conversions or insufficient spend before comparing performance. An ad with a 6x ROAS on 8 conversions tells you almost nothing. An ad with a 3.2x ROAS on 200 conversions tells you everything. Premature conclusions from thin data are one of the most expensive habits in performance marketing.
Step 3: Check frequency before blaming creative
Frequency above 2.5 with rising CPM and declining CTR signals audience fatigue, not necessarily a creative problem. The fix is an audience refresh, not a new ad. Many teams burn cycles making new creatives when the real issue is that the same people have seen the ad six times. Check frequency first.
Step 4: Segment your analysis
Do not evaluate ads at the campaign level. Break it down by:
- Campaign: Are budget and objective settings creating performance differences?
- Audience: Is one audience segment inflating or dragging overall numbers?
- Creative: Which specific visual and copy combination is driving results?
For deeper insight into analyzing ad creatives at the concept level, you need tagging that captures format, hook type, and angle. Without it, you are comparing apples to oranges and calling it creative testing.
Step 5: Diagnose performance issues
Use this simple diagnostic logic:
- Low CTR = the creative hook is not working. The problem lives in the first three seconds of video or the headline and visual of a static.
- High CTR but low conversion rate (CVR) = the landing page or offer is not matching the ad's promise. This is not a creative problem. Check your crafting effective CTAs and landing page alignment.
- Rising CPM with no CTR improvement = you are competing for an oversaturated audience. Consider types of ad placements and new audience segments.
Step 6: Build a performance dashboard
Track CPM, CTR, CVR, ROAS, and CPA over time for every active creative. Patterns matter more than point-in-time numbers. A creative that was delivering a 4x ROAS two weeks ago and is now at 2.1x is telling you something important before your headline metrics catch up. Analytics driving better ROI is about spotting those trend lines early, not reading static snapshots.
Pro Tip: Set up a simple weekly review rhythm. Every Monday, pull the last 7 days and 30 days of data side by side. The divergence between short-term and longer-term metrics is often where you first spot fatigue or an emerging winner.
With the process clear, let's examine common mistakes and how to troubleshoot them.
Troubleshooting common pitfalls when identifying top ads
Even with the right process, there are a handful of errors that reliably trip up performance teams. Here are the ones worth knowing specifically.
Turning off ads too early
Stopping ads before reaching 50 conversions leads to decisions made on thin data and missed winners. Meta's algorithm also needs time to exit the learning phase, which requires roughly 50 optimization events per week. Kill an ad at 20 conversions and you are guessing, not deciding.
Misreading creative fatigue
Fatigue is not just a feeling. It has a specific data signature. Frequency above 5 on TikTok signals fatigue, causing CPA spikes that look like creative failure. The key difference: if frequency is high and CTR is falling, the audience is saturated. If frequency is low and CTR is falling, your creative is the actual problem.
Confusing landing page problems with ad problems
If your CTR is above 1.5% but your CVR is below 1%, your ad is doing its job. The drop is happening after the click. This is one of the most common misdiagnoses in ecommerce. Before you rebuild the creative, check your landing page for load speed, offer clarity, and CTA friction.
Ignoring attribution windows
Not all conversions register immediately. A customer might see your ad, browse for two days, and convert on day three. If you are evaluating an ad's CPA after 24 hours, you are looking at an incomplete picture. Allow enough time in your attribution window before concluding on performance, especially for higher-consideration products.
Most underperforming ads are not bad creatives. They are good creatives evaluated too early, against the wrong audience, with broken tracking, on an overly short timeline. Fix the evaluation before fixing the ad.
- Check that your Pixel and CAPI are both firing and not double-counting events
- Confirm your attribution window matches your typical purchase cycle
- Look at frequency before swapping creative
- Give ads time to exit learning phase before drawing conclusions
- Separate boosting ad performance analysis from targeting analysis
Pro Tip: Run a pixel diagnostics check monthly. Event match quality scores below 6.0 in Meta's Events Manager are actively degrading your ROAS data and your algorithm's optimization decisions. This is one of the highest-leverage fixes most teams never make.
Now that common errors are clear, let's review how to measure success and what to expect from this approach.
Verifying success: expected results and optimization next steps
Identifying a top performer is only valuable if you act on it correctly. Scaling too fast, or not fast enough, both cost money.
Benchmarks that confirm a winner
Use these as your confirmation thresholds:
- ROAS above 2.0 (higher for lower-margin products)
- CTR above 1.0% for Meta static and video
- Hook Rate above 25% for TikTok video
- Stable or declining CPA over the last 14 days
- Frequency below 3.0
An ad that clears all five of these bars is a genuine winner worth scaling. An ad that clears three but is failing on frequency is a winner that is already burning out.
Scaling strategy: horizontal vs. vertical
| Strategy | What it means | Best for |
|---|---|---|
| Horizontal scaling | Expanding into new audiences with the winning creative | Early scaling, avoiding saturation |
| Vertical scaling | Increasing budget on existing winning ad sets | Proven winners with low frequency |
Start horizontal when frequency is above 2.0. Move vertical only when you have confirmed performance across audience segments. Most teams default to vertical scaling because it is simpler. That usually ends in saturation within two weeks.
Creative rotation cadence
Top-spending brands rotate underperforming creatives every 10 to 14 days to maintain efficiency. This is not about throwing away what works. It is about having a pipeline of new variations ready so you are never forced to keep running a fatigued asset because there is nothing to replace it with.
Creative velocity and continuous testing are the variables that determine whether your CPM stays controlled or slowly inflates quarter over quarter. The brands that win on Meta and TikTok long-term are not just good at finding winners. They are good at replacing them before they expire.
- Scale winning creatives with budget increases of 20 to 30% every 3 to 4 days, not overnight jumps
- Set frequency alerts at 2.5 to catch fatigue before it shows in CPA
- Maintain at least 3 to 5 active creative tests per campaign at all times
- Review scaling ads profitably approaches every quarter as platform dynamics shift
Pro Tip: Build a "winner archive" of your top-performing creatives, tagged by hook type, offer angle, and format. When a concept works once, it often works again with a refreshed visual or new hook. Study your social media ad examples from your own account before looking anywhere else.
Having covered verification, here is a unique perspective on best practices and common misconceptions.
Why focusing solely on ROAS is risky: a deeper approach to identifying top ads
Every performance team knows ROAS matters. The ones who consistently outperform have learned to distrust it when it shows up alone.
ROAS tells you what happened at the business level. It does not tell you why, for how long, or whether the underlying mechanics are healthy. An ad showing a 4x ROAS might be converting a tiny, highly responsive segment of your retargeting audience. That segment will exhaust itself. The ROAS will collapse suddenly. And if ROAS was your only signal, you never saw it coming.
ROAS alone misses critical creative and audience fatigue signals on TikTok. Hook Rate, watch time, and engagement rate are telling you whether the creative still has life in it, usually 7 to 10 days before ROAS starts to fall. That gap is real money. Teams that read these signals act. Teams that only watch ROAS react.
There is also a tracking dimension that most conversations skip. Meta automation outcomes depend on tracking data quality far beyond the surface ROAS number. When your conversion signals are incomplete or miscategorized, Meta's algorithm optimizes toward the wrong events. The ROAS looks fine in the dashboard while the algorithm quietly learns to find the wrong kind of buyer. By the time the mismatch is obvious, you have trained the system in the wrong direction for weeks.
The real insight is this: ROAS is the output. Why ad creatives drive ROAS comes down to inputs you can actually control. Treat Hook Rate, frequency, CTR, and tracking quality as the leading indicators. Treat ROAS as the lagging confirmation. When all of them are healthy, ROAS follows. When one of them starts slipping, you have a week's warning before the numbers everyone watches starts moving. That week is the entire game.
The teams who consistently analyze and boost ROAS are not reading more data. They are reading the right data in the right order, acting on leading signals instead of waiting for lagging ones to force their hand.
Optimize your ad creatives and performance with Creaboost
Most ecommerce teams already know what good creative analysis looks like. The problem is that doing it well requires tagging discipline, consistent review cadence, and a pipeline of new variations ready to replace fatiguing assets. Most teams have none of the three.
Creaboost handles the operational layer that makes this possible at scale. Creative performance analytics connect directly to your ad accounts and auto-tag every asset by format, hook, angle, and concept, so your weekly review takes minutes instead of half a day. AI ad creative generation turns a product URL into platform-ready variations so your creative pipeline never runs dry. Automated alerts flag fatigue and budget thresholds before they show up in your headline metrics. If your team is tired of being reactive, explore Creaboost pricing and see how quickly a tighter creative loop changes your numbers.
Frequently asked questions
What is the most important metric to identify a top-performing ad?
ROAS is your king metric for measuring profitability, but it should always be read alongside CTR and CPA to confirm the ad is both profitable and mechanically healthy.
How can I tell if an ad is fatigued?
Frequency above 2.5 with rising CPM and declining CTR is the clearest fatigue signal, meaning the audience has seen the ad too many times rather than the creative itself failing.
Why should I not rely solely on ROAS for ad evaluation?
ROAS alone misses creative and audience fatigue signals like Hook Rate and frequency trends, which typically deteriorate 7 to 10 days before ROAS starts dropping.
How long should I wait before deciding an ad's performance?
Ads should reach 50 conversions before you draw reliability conclusions, giving the algorithm time to exit the learning phase and your data time to accurately reflect conversion patterns.
What tools can help me track competitor ads effectively?
Meta's Ad Library and Panoramata offer detailed views of competitors' active ads, including which creatives have been running longest and what copy patterns repeat across a vertical.