

You're spending real money on Meta and TikTok, but you genuinely don't know which creatives are earning it back. That's not a targeting problem or a bidding problem. It's an analysis problem. Most performance teams are flying on impressions and gut feel, making kill decisions too early, scaling losers by accident, and repeating the same creative directions quarter after quarter because nobody documented what actually worked last time. This guide walks you through a rigorous, repeatable framework for ad creative performance analysis: from infrastructure and naming to experiment design, result interpretation, and building a learning loop that compounds over time.
Table of Contents
- What you need for accurate creative analysis
- How to structure and run a creative experiment
- Analyzing results and making data-driven decisions
- Troubleshooting and common mistakes in creative analysis
- Beyond the basics: Why creative analysis unlocks compounding growth
- Ready to analyze and scale your ad creatives?
- Frequently asked questions
Key Takeaways
| Point | Details |
|---|---|
| Structure matters most | Organized naming and tracking enable actionable ad creative insights at scale. |
| Run true experiments | Incrementality testing reveals which creatives actually drive sales. |
| Analyze beyond surface metrics | Deep pattern analysis uncovers formats, hooks, and angles that lift ROAS. |
| Avoid underpowered tests | Insufficient spend or volume leads to wrong kill/scale decisions. |
What you need for accurate creative analysis
To build a foundation for meaningful analysis, you need to gather the core tools and resources that enable reliable outcomes before you run a single test.
The biggest structural mistake teams make is fragmented data. If your Meta performance lives in one tab, your TikTok data in another, and your creative inventory in a shared drive with inconsistent file names, you'll never get a clean read on what's working. Centralizing tracking across platforms isn't optional. It's the precondition for everything else.
The second requirement is a creative taxonomy: a consistent naming convention that encodes key attributes directly into every creative's name. According to practitioners, creative testing infrastructure that supports efficient optimization at scale includes centralized tracking plus a consistent creative taxonomy, naming creatives by hook, angle, and format. Without that structure, you can't query your data to find patterns. You're just looking at a wall of asset IDs.
Here's what your setup needs to include before you start any analysis:
- Clean naming conventions applied consistently across every creative and campaign
- Analytics access to both Meta Ads Manager and TikTok Ads Manager at the ad level
- A defined taxonomy covering at least three dimensions: hook type, creative angle, and format
- Minimum spend thresholds established per variant so you're not killing tests early
- A shared workflow so everyone on the team, including media buyers and creative directors, uses the same tagging and versioning system
- A centralized repository (dedicated platform or structured spreadsheet) for logging results
Pro Tip: Enforce taxonomy from day one. Retroactively renaming hundreds of assets is miserable work and most teams never finish it. Start structured or the discipline collapses within a quarter.
Tools and frameworks for creative analysis
| Tool or framework | Primary use | Strength |
|---|---|---|
| Meta Ads Manager (ad level) | Platform-native creative performance | Impression, CTR, ROAS by creative |
| TikTok Ads Manager | Platform-native video performance | Hook rate, watch time, CVR |
| Dedicated creative analytics platform | Cross-platform tagging and taxonomy | Cohort-level ROAS by angle or format |
| Structured naming convention | Taxonomy enforcement | Queryable data at scale |
| Experiment log (sheet or platform) | Learning documentation | Pattern recognition across cycles |
Looking at ad creative best practices that actually move ROAS, the teams that perform consistently all have one thing in common: they treat their creative data as queryable infrastructure, not just a reporting view.
How to structure and run a creative experiment
With your foundations set, the next step is structuring creative tests that move beyond gut feel or surface metrics.

Most teams run what they call "tests" but are actually just A/B observations in a live campaign environment. The problem is that without a control group that never sees the treatment creative, you're measuring correlation, not causation. Someone who would have converted anyway gets attributed to your new hook. Your results look good. You scale. Nothing changes. Incrementality and holdout experiments that compare a treatment creative against a control group that is not shown the treatment are the standard for measuring true creative impact, not just correlated lift.
Here's how to design and run a clean creative experiment:
- Define one variable. Test one creative element at a time: hook, offer framing, visual format, or CTA. Changing multiple elements in the same test makes it impossible to know what drove the result.
- Segment your audience into isolated cells. On Meta, use separate ad sets with audience segments that don't overlap. On TikTok, use campaign-level splits to maintain cell integrity.
- Set a holdout cell. Exclude a portion of your audience from seeing the treatment creative entirely. This is your control. Without it, you're guessing.
- Establish minimum spend per variant. Practitioners consistently recommend sufficient spend per variant before making any kill decisions. A general floor is $500 to $1,000 per variant in most e-commerce verticals, though higher AOV products may need more.
- Set a fixed measurement window. Decide upfront whether you're measuring at day 3, day 7, or day 14. Day 7 is the most common standard for purchase-intent campaigns.
- Log everything before launch. Creative name (in full taxonomy format), hypothesis, expected outcome, cell definitions, and spend cap. If it's not logged, the learning evaporates.
Without a control group, your test results tell you what happened, not what your creative caused. Most "winning" creatives in uncontrolled tests are just lucky recipients of favorable delivery conditions.
Pro Tip: Run your incrementality test as a step-by-step ad boost process rather than a one-time event. Each test should ladder into the next one with a documented hypothesis.
Classic attribution vs. holdout experiment
| Dimension | Classic attribution | Holdout/incrementality |
|---|---|---|
| Measures | Correlated performance | Causal lift |
| Control group | None | Yes, excluded from treatment |
| Risk of false positives | High | Low |
| Setup complexity | Low | Medium |
| Decision confidence | Low to medium | High |
| Best for | Quick directional signals | Scaling decisions |
The practical implication here: use classic attribution for early directional reads, but never use it alone as the basis for a scale decision. You need scaling Meta and TikTok ads to be grounded in real causal evidence, not just platform-reported ROAS that could be heavily influenced by delivery algorithm bias.
Analyzing results and making data-driven decisions
Once experiments conclude, you'll need to turn quantitative and qualitative findings into clear actions for your next campaigns.
The first thing to check is not which creative had the highest ROAS. It's which creative had the highest incremental ROAS against the holdout. These are often different assets. A creative with a high platform-reported ROAS might be getting served to your most purchase-ready segments by the algorithm. The holdout comparison strips that advantage out and shows you what the creative actually caused.
Here's what to look for after a test wraps:
- Holdout lift by creative variant: Did the treatment group meaningfully outperform the control? What was the delta?
- ROAS at day 7 by creative: Which assets drove the best return within the measurement window?
- Hook-level and angle-level aggregates: Using your taxonomy, group results by hook type and angle to see which creative patterns generalize
- Format winners: Did video outperform static? Did carousel beat single image? Note which formats correlate with better performance for your specific audience
- Fatigue signals: Did performance drop significantly over the test window? If yes, that creative has a short shelf life at scale
The unified naming convention is what makes this analysis possible at scale. It lets you query which creative attributes correlate with higher day 7 ROAS across your entire account, not just within a single test. That's the difference between a data point and a pattern.
Sample outcome structure
| Creative variant | Cell | Day 7 ROAS | Holdout lift | Decision |
|---|---|---|---|---|
| Hook A / Angle: social proof / Static | Treatment | 4.2x | +31% | Scale |
| Hook B / Angle: urgency / Video | Treatment | 3.1x | +8% | Monitor |
| Hook C / Angle: founder story / Static | Treatment | 2.4x | Negative | Kill |
| Hook D / Angle: comparison / Carousel | Treatment | 3.9x | +22% | Scale |
Once you know your winners, move fast. Increase budget on the top performers and pause the underperformers immediately. Don't let sentiment or sunk cost keep a losing creative live. Then document the learning explicitly: Social proof hooks outperformed urgency hooks in this product category at this price point during this time window. That sentence is more valuable than the ROAS number because it informs your next brief.
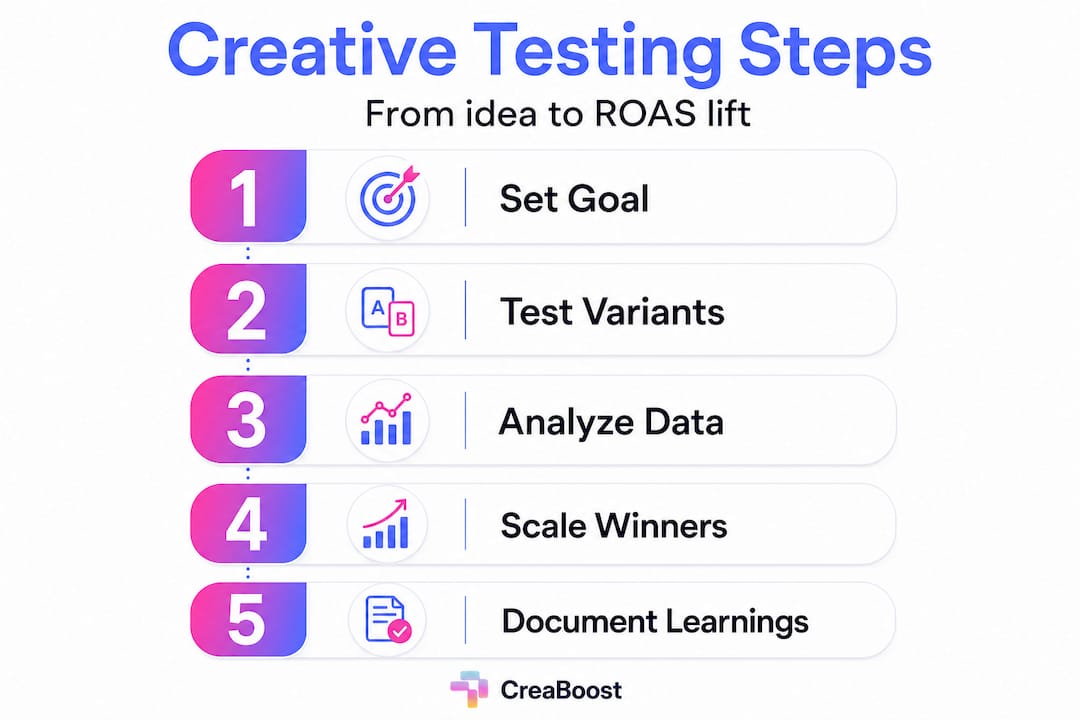
Review what's driving creative ROAS lifts at the attribute level, not just the asset level, and feed those findings directly into your discovery and briefing process. When you understand why an angle works, you can generate five more hypotheses from that single result. That's where the compounding starts.
Learning documentation should be a mandatory part of closing every test cycle. Build a simple template: hypothesis, test setup, result, key insight, recommended next test. Teams that skip this step repeat their own mistakes constantly, often without realizing it. Teams that do it build an intellectual property asset that makes every future cycle faster and more targeted. You can find a framework for building high-performing creatives that treats documentation as a core step, not an afterthought.
Troubleshooting and common mistakes in creative analysis
Even well-planned tests can go sideways. Here's how to spot and resolve the most common problems before they damage your ROAS.
The most frequent mistake is underpowered tests. Sufficient spend and volume per variant are necessary before making kill decisions. Teams pull the plug after three days and $200 in spend, see no signal, and call the creative a loser. Then they never test that angle again. The creative may have needed more runway. You'll never know.
Here are the top five mistakes performance teams make in creative analysis:
- Underfunded tests: Running variants below minimum spend thresholds generates noisy, unreliable data. Set a spend floor and respect it.
- Acting on single-day data: One day of performance tells you almost nothing about a creative's true potential or its fatigue trajectory. Minimum seven days for purchase campaigns.
- Inconsistent or broken taxonomy: If naming conventions aren't enforced, you can't aggregate results across tests. Your analysis becomes impossible to query and the learnings stay siloed.
- Testing too many variables simultaneously: Changing the hook, the visual, and the offer in the same creative makes it impossible to isolate cause. You just added noise.
- Confusing delivery volume with performance: A creative with 10x the impressions of another isn't 10x better. The algorithm may just favor it for delivery reasons unrelated to actual conversion performance.
Pro Tip: Audit your creative mapping before every analysis cycle. Taxonomy mistakes, like mislabeled hooks or inconsistent angle tags, produce bad decisions. Garbage in, garbage out. Check the raw creative insights against your naming convention before you trust any aggregate finding.
If you suspect a test is underpowered, check three things: total spend per variant, number of purchase events recorded, and days elapsed. If any of those three numbers are below your preset thresholds, extend the test before drawing conclusions. The cost of extending a test by three days is almost always lower than the cost of killing a winning creative based on a false negative.
Beyond the basics: Why creative analysis unlocks compounding growth
Here's the perspective most guides skip. Creative analysis is not primarily about finding the winning creative. It's about building a system that makes every future creative cycle smarter than the last.
Most brands treat a test result as a binary outcome: winner or loser. They scale the winner, kill the loser, and start fresh next cycle from a blank brief. That's not analysis. That's a one-time lottery draw. The teams that build genuine competitive advantage do something fundamentally different. They treat every test result as a deposit into an intellectual property bank. This angle outperformed with this audience at this price point. That's an insight with a three-quarter lifespan, not just a campaign decision.
The consistency of your taxonomy is what makes that possible. When you name creatives by hook, angle, and format from day one and never let that slip, you can run a query six months later and instantly see that social proof angles outperform comparison angles by 18% in your vertical, at that specific price tier, on static format. That's the kind of compound knowledge advantage that widens every quarter. Your competitors are still briefing from scratch. You're briefing from evidence.
There's also a discipline issue that most performance teams won't admit out loud: standard platform reporting actively misleads you. It surfaces the creatives that got delivered the most, not the ones that caused the most conversions. Conflating delivery volume with performance is one of the most expensive mistakes in paid media. True creative analysis, with controlled experiments and taxonomy-driven aggregation, is the only reliable way to know what your creative is actually doing. Following advanced best practices that challenge surface-level reporting is not optional at scale. It's survival.
The brands that are pulling away from their competitors right now are not running bigger budgets. They're running tighter loops. They ship a hypothesis, measure it rigorously, extract a portable insight, and brief the next cycle from evidence rather than intuition. That compounding loop is the actual moat. Creative analysis is how you build it.
Ready to analyze and scale your ad creatives?
The frameworks in this guide work. But executing them manually across multiple ad accounts, with spreadsheets, fragmented tooling, and a naming convention that slowly breaks down under team turnover, is a grind that quietly eats most performance teams alive.
Creaboost is built to automate the entire creative loop described here. Analyze creatives instantly by connecting your ad accounts directly: every creative gets auto-tagged by format, hook, angle, and concept, so the taxonomy discipline that usually collapses within a quarter runs automatically. You catch fatigue signals a week before the platforms flag them, scale real winners with confidence, and stop wasting budget on assets that have already burned out. Need more variations to test? AI ad creation turns a product URL into dozens of platform-ready static ads in minutes. Everything feeds into one source of truth. See pricing and get your first analysis running this week.
Frequently asked questions
What is the most reliable way to measure ad creative impact?
Holdout or incrementality experiments comparing treatment and control groups give you the most objective read on true creative lift, stripping out the delivery bias and correlation errors that standard attribution produces.
How should I name my ad creatives for better analysis?
Use a consistent naming taxonomy that encodes hook type, creative angle, and format directly into the asset name so you can query patterns across experiments and aggregate results at the attribute level.
What spend is needed for a valid creative test?
Each variant needs sufficient spend and purchase volume to reach statistically meaningful conclusions. A common floor is $500 to $1,000 per variant in standard e-commerce verticals before you make any kill or scale decision.
Can I use regular platform reports for creative analysis?
Platform reports give you useful directional signals, but true causal lift only shows up through controlled holdout experiments. Raw reporting data reflects delivery patterns as much as it reflects creative performance.