
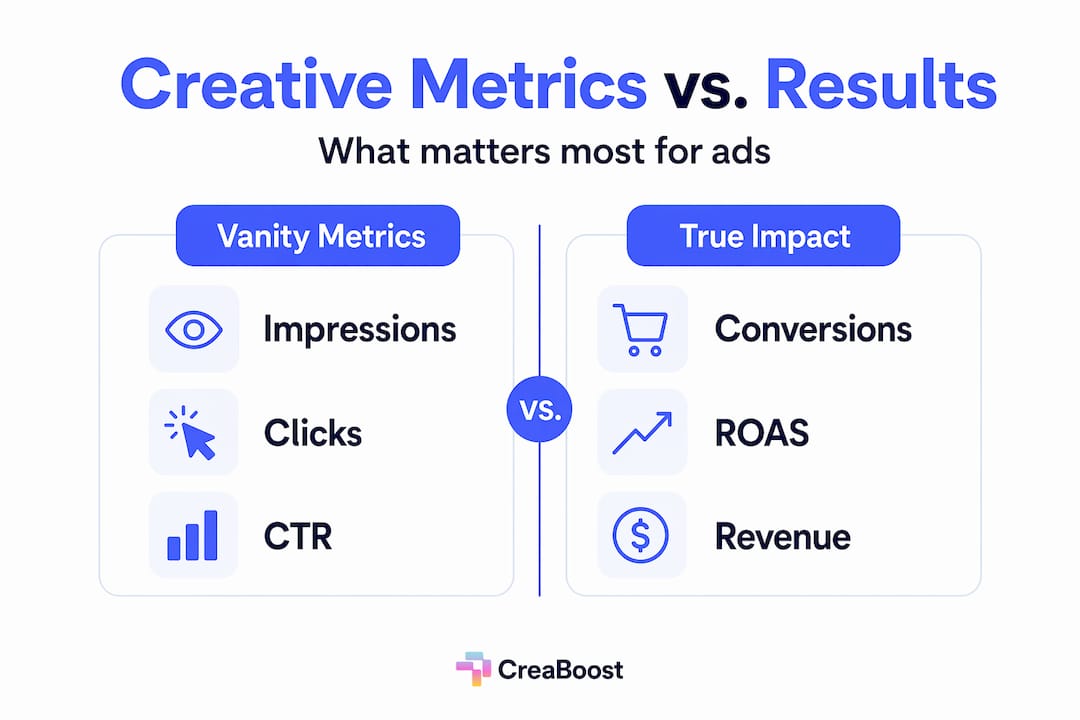
Most performance marketers are measuring the wrong things. They're watching CTR tick up, celebrating a low CPM, and calling it a win, while their actual creative performance metrics, the ones tied to revenue, tell a completely different story. On Meta and TikTok especially, surface-level numbers create a false sense of confidence. A creative can pull a 4% CTR and still tank your ROAS if the audience it attracts never converts. This guide breaks down which metrics actually predict ecommerce success, how to track them at scale, when to refresh fatigued assets, and how to run tests that generate real learning, not just data.
Table of Contents
- The key creative performance metrics that actually matter
- How to track and analyze creative ad performance at scale
- Diagnosing creative fatigue: Signs, triggers, and when to refresh
- Benchmarking creative performance: Meta and TikTok industry standards
- Experimental design for deeper creative insight: Split testing and incrementality
- A smarter framework: Beyond click rates, what seasoned growth teams really measure
- Supercharge your creative performance measurement with Creaboost
- Frequently asked questions
Key Takeaways
| Point | Details |
|---|---|
| Measure what matters | Track both early engagement and revenue-linked KPIs for true creative insights. |
| Use rolling analysis | Review creative metrics over 7–30-day windows to detect trends and fatigue accurately. |
| Benchmark for context | Compare your Meta and TikTok results against industry medians as a guiding reference. |
| Test for causality | Design split tests and incrementality experiments to validate which creative assets truly drive results. |
| Refresh before fatigue | Watch for frequency rises and CTR drops to know when to rotate creative for sustained performance. |
The key creative performance metrics that actually matter
Not all metrics are created equal, and confusing them costs budget. Ad testing metrics span two distinct categories: attention and relevance indicators like CTR, thumb-stop rate, and watch time, and downstream revenue indicators like CPA, ROAS, and conversion rate. Both matter, but they answer different questions.
Top-of-funnel metrics tell you whether your creative is earning attention:
- Thumb-stop rate (also called hook rate): the percentage of people who pause on your ad rather than scroll past. On TikTok, anything above 25% is worth noting.
- CTR (click-through rate): clicks divided by impressions. Useful for gauging creative relevance, but easy to game with clickbait.
- Watch time / engagement rate: how long people stay with your video, and whether they interact. A strong proxy for message resonance.
- CPM (cost per thousand impressions): reflects auction competitiveness and audience saturation. Lower is not always better; a high CPM in a high-intent audience can still yield great returns.
- Reach and frequency: how many unique users saw your ad, and how many times each. Frequency is a leading fatigue indicator.
Bottom-of-funnel metrics tell you whether your creative is driving business results:
- Conversion rate (CVR): the share of clicks that turn into purchases. This is where creative message alignment with the landing page shows up.
- CPA (cost per acquisition): total spend divided by conversions. The clearest signal of creative efficiency.
- ROAS (return on ad spend): revenue divided by spend. The number your CFO actually cares about.
The teams that learn fastest are the ones who connect creative decisions to downstream revenue, not just clicks. If your reporting stops at CTR, you're flying blind on what actually moves the needle.
The trap most ecommerce brands fall into is optimizing for front-end metrics because they're fast and visible. But CTR alone can be misleading without connecting to downstream conversion and revenue KPIs. A creative that drives curiosity clicks from the wrong audience will look great in your dashboard and destroy your CPA at the same time. Understanding how analytics drives ROI means building a reporting stack where attention metrics and revenue metrics are always visible together, never in isolation.
Following ad creative best practices means treating CTR as a diagnostic, not a destination. It tells you the creative earned a click. ROAS tells you whether that click was worth anything.

How to track and analyze creative ad performance at scale
Knowing what to measure is step one. Building a system that captures those numbers consistently, across dozens of active creatives, is where most teams break down. Daily logging by ad asset combined with rolling 7- and 30-day windows is the foundation for detecting fatigue and real performance trends, as opposed to daily noise.
Here is a practical workflow for multi-platform ad growth:
- Tag every creative at upload. Format, hook type, angle, offer, and concept. If you skip this step, your analysis later is guesswork.
- Log daily performance per asset. Pull spend, impressions, CTR, CVR, CPA, and ROAS for each creative every day. Even a simple spreadsheet beats nothing.
- Apply rolling windows. A 7-day window smooths out day-of-week variation. A 30-day window shows trend direction. Use both.
- Set performance thresholds. Define in advance what a "winner" looks like (e.g., CPA below $35, ROAS above 2.0) so you're not making judgment calls on vibes.
- Flag outliers weekly. Creatives that are 20% above or below your CPA threshold get reviewed, not just noted.
- Document learnings, not just results. Record why you think a creative performed the way it did. This is how you build institutional knowledge.
Here is what a rolling window report looks like in practice:
| Creative ID | Format | Hook type | 7-day CTR | 7-day CPA | 30-day ROAS | Frequency | Status |
|---|---|---|---|---|---|---|---|
| CR-041 | Video | Problem/solution | 3.1% | $28.40 | 2.6 | 1.8 | Scaling |
| CR-038 | Static | Lifestyle | 1.9% | $44.10 | 1.4 | 3.2 | Fatigued |
| CR-045 | Carousel | Social proof | 2.7% | $31.00 | 2.1 | 1.2 | Testing |
| CR-033 | Video | Unboxing | 4.2% | $52.80 | 0.9 | 4.1 | Pause |
Pro Tip: Only change one creative variable per test. Changing multiple elements at once makes it impossible to attribute what drove the performance difference. Test hook vs. hook, or visual style vs. visual style, never both at the same time.
The discipline here is what separates teams that learn from teams that just spend. Your ad creative analysis methodologies should be documented and repeatable, not rebuilt from scratch every quarter.
Diagnosing creative fatigue: Signs, triggers, and when to refresh
Creative fatigue follows a predictable sequence, and if you know the pattern, you can catch it before your CPA visibly spikes. The classic progression goes: frequency rises, impression share plateaus, CTR starts decaying, and then CPA climbs. By the time CPA is clearly elevated, you have usually been losing efficiency for 7 to 14 days.
Fatigue detection can be operationalized by tracking CTR decay, frequency, and CPA spikes together, not as isolated signals. Here are the early warning signs to watch:
- Frequency above 2.5 in Meta prospecting campaigns. This is the threshold where audience saturation starts degrading performance for most ecommerce brands.
- CTR dropping more than 15% week over week without a corresponding drop in spend. The creative is burning out, not the budget.
- Watch time declining on video assets. If people are bailing earlier in the video than they were two weeks ago, the hook is losing novelty.
- CVR falling while CTR holds steady. This is a subtler signal. The creative is still getting clicks, but those clicks are converting less. Often means the wrong audience is clicking.
- CPA creeping up 10 to 20% over 10 days. Not a spike, just a slow drift. Easy to miss without rolling windows.
Pro Tip: Don't rely on platform-native fatigue labels alone. Meta's "creative fatigue" notification typically fires after the damage is already done. Build your own threshold-based alerts using frequency and CTR decay as leading indicators, not lagging ones.
When the signals appear, the response should be systematic. Refresh the hook first, since that is the element that drives thumb-stop and initial engagement. Then test a new visual style or format. Finally, rotate the offer angle or proof point. You rarely need to rebuild from scratch. Most fatigue is hook fatigue, not concept fatigue. Your creative refresh best practices should treat the hook as the highest-leverage variable to rotate.
Benchmarking creative performance: Meta and TikTok industry standards
Measuring creative success in a vacuum is only half useful. You need context. Here are current industry medians to calibrate your expectations across both platforms.
| Metric | Meta ecommerce (2026) | TikTok ecommerce (2025) |
|---|---|---|
| CPM | $14.19 | $13.26 |
| CPA | $38.19 | $32.74 |
| CVR | 1.6% | 2.01% |
| ROAS | 1.86 | 2.21 |
| CTR | 2.19% | 1.77% |
| AOV / MER | $71.69 (AOV) | 0.39 (MER) |
Meta ecommerce medians show a CPM of $14.19, CPA of $38.19, and ROAS of 1.86. TikTok industry medians for 2025 show a CPA of $32.74, CPM of $13.26, CVR of 2.01%, and ROAS of 2.21. TikTok's lower CPA and higher CVR reflect a younger, more impulse-driven purchase environment, which has direct implications for creative style.
Benchmarks are a compass, not a destination. Use them to identify whether you have a structural problem or a creative problem, but never let industry medians replace the discipline of testing against your own historical performance.
A few practical notes on using these numbers. If your CPA is running 40% above the median, that is a signal worth investigating, but it does not automatically mean your creative is the problem. Audience quality, offer competitiveness, and landing page experience all play a role. Benchmarks help you ask better questions. They do not answer them. Addressing digital marketing challenges means using benchmarks as diagnostic tools, not report card grades.
For TikTok creative performance, the higher CVR relative to Meta suggests that when TikTok content lands, it lands fast. Your hook and first three seconds carry more weight on TikTok than almost any other element.
Experimental design for deeper creative insight: Split testing and incrementality
Daily monitoring tells you what is happening. Controlled experiments tell you why. These are different disciplines, and the best growth teams run both in parallel.
For split tests, the most common mistake is ending them too early. TikTok split tests need at least 7 days to account for day-of-week variation in purchase behavior, equal budget allocation across variants, and comparable audience sample sizes. A test that runs Tuesday through Thursday and declares a winner is not a test. It is a guess with extra steps.
For incrementality testing, the bar is higher. Asset uplift tests require at least 50 conversions per group and a 4-week test duration to generate statistically reliable results. The setup involves a treatment group (exposed to the new creative) and a control group (exposed to a holdout or existing creative), with all other variables held constant.
Here is a clean split test setup for ROI optimization:
- Define one hypothesis. Example: "A problem/solution hook will outperform a lifestyle hook for our core 25-34 female audience."
- Create two variants. Identical in every way except the single variable being tested.
- Set equal budgets. Split spend 50/50 across variants from day one.
- Run for at least 7 days on TikTok, or until each variant has at least 50 conversion events.
- Evaluate on your primary KPI. CPA or ROAS, not CTR.
- Document the result and the hypothesis outcome. Did the data confirm or reject your hypothesis? Both outcomes are valuable.
Pro Tip: Always define statistical significance thresholds before you start, not after. If you wait until the data looks good to call a winner, you are introducing bias. Aim for 90% confidence minimum before scaling winning creatives.
A smarter framework: Beyond click rates, what seasoned growth teams really measure
Here is the uncomfortable truth about creative performance evaluation in ecommerce: most teams are optimizing for metrics that feel good to report, not metrics that drive decisions. High CTR gets celebrated in Monday standups. Low CPA gets celebrated by the CFO. These are not the same conversation.
The teams that consistently win are not necessarily running more tests. They are asking better questions. They do not just ask "which creative performed better?" They ask "why did it perform better, and what does that tell us about our customer?" That second question is where advanced creative measurement insights live, and most teams never get there because they are too busy chasing the next launch.
There is a specific failure mode worth naming. When front-end metrics soar but CPA and ROAS disappoint, the instinct is to blame the algorithm or the audience. The real culprit is almost always a message mismatch. The creative made a promise the landing page did not keep, or it attracted curiosity clicks from people who were never going to buy. This is a creative strategy problem, not a targeting problem, and you cannot fix it by adjusting bids.
The best growth teams build a culture of hypothesis-driven testing. Before any creative goes live, there is a written hypothesis: what they expect to happen, why, and what they will do with the result either way. This sounds like process overhead. In practice, it is the difference between a team that accumulates knowledge and a team that accumulates data. Data without interpretation is just noise. Measurement without a framework is just reporting.
Supercharge your creative performance measurement with Creaboost
If this guide has made one thing clear, it is that measuring creative impact well is a systems problem, not a spreadsheet problem. You need automated tagging, rolling window analysis, fatigue alerts, and split test tracking all working together, and most teams are trying to stitch that together manually across three or four tools.
Creaboost is built specifically for this. The Analyze feature connects directly to your Meta and TikTok ad accounts, auto-tags every creative by hook, format, angle, and concept, and surfaces fatigue signals before they hit your headline metrics. You stop guessing which concepts are driving ROAS and start knowing. Pair that with AI ad creative generation to ship new variants fast when a refresh is needed, and you have a closed loop from insight to execution. The Creaboost platform gives your team one source of truth for creative performance, so Monday morning starts with answers, not questions.
Frequently asked questions
What is the difference between CTR and ROAS for creative measurement?
CTR shows how often your creative gets clicked, but ROAS reveals if those clicks actually deliver profitable revenue. CTR alone can be misleading without connecting to downstream conversion and revenue KPIs, making ROAS the more reliable indicator of true creative effectiveness.
How long should I run a creative split test for reliable results?
Run tests for a minimum of 7 days on TikTok to account for daily purchase behavior variation, and continue until each variant has enough conversions to reach statistical significance. TikTok split tests require adequate duration, equal budgeting, and comparable sample sizes to generate trustworthy results.
What are typical benchmarks for TikTok ad creative in ecommerce?
Based on 2025 data, TikTok industry medians show a median CPA of $32.74, CPM of $13.26, and CTR of 1.77%. Use these as directional reference points, not hard targets.
How do I know when my creative is fatigued?
Rising ad frequency, decaying CTR week over week, and a gradual CPA spike are the clearest signals. Fatigue detection works best when you track CTR decay, frequency, and CPA together rather than waiting for any single metric to cross a threshold.
Why should I use rolling windows for performance analysis?
Rolling 7- or 30-day windows smooth out daily noise and reveal genuine creative trends rather than one-day anomalies. Daily logging by asset combined with rolling windows is the most reliable method for detecting fatigue and identifying real winners before budget is wasted.