
Digital ad analysis is the systematic process of evaluating campaign data from ads, websites, and CRM systems to understand what drives performance and make informed optimization decisions. It is not a reporting exercise. It is a diagnostic practice that separates teams who scale winners from teams who keep spending on creative that burned out two weeks ago. The core inputs are metrics like click-through rate (CTR), cost per click (CPC), conversion rate, return on ad spend (ROAS), and cost per acquisition (CPA), pulled from platforms like Meta Ads and Google Ads and unified with site analytics and CRM data. When done correctly, digital advertising analysis turns raw numbers into decisions.
What is digital ad analysis and why does it matter?
Digital ad analysis is defined as using data from ads, websites, and CRM conversions to evaluate marketing performance and guide decisions. The distinction between analysis and reporting is not semantic. Reporting tells you what happened. Analysis tells you why it happened and what to do next. A team that only reports sees a CPA spike and shrugs. A team that analyzes sees the CPA spike, traces it to a single ad set with frequency above 3.0, and pauses it before the week ends.
The importance of ad analysis compounds over time. Every campaign you run generates data that either teaches you something or gets ignored. Teams that build a structured analysis habit accumulate a library of tested hypotheses, proven creative angles, and audience insights that competitors cannot buy. That institutional knowledge is the actual moat in paid advertising, not budget size.

For business owners, the practical case is straightforward. Ad spend without analysis is guesswork with a credit card. For digital marketers, analysis is the skill that justifies every optimization recommendation you make to a client or stakeholder.
What are the key metrics and data sources in ad performance analysis?
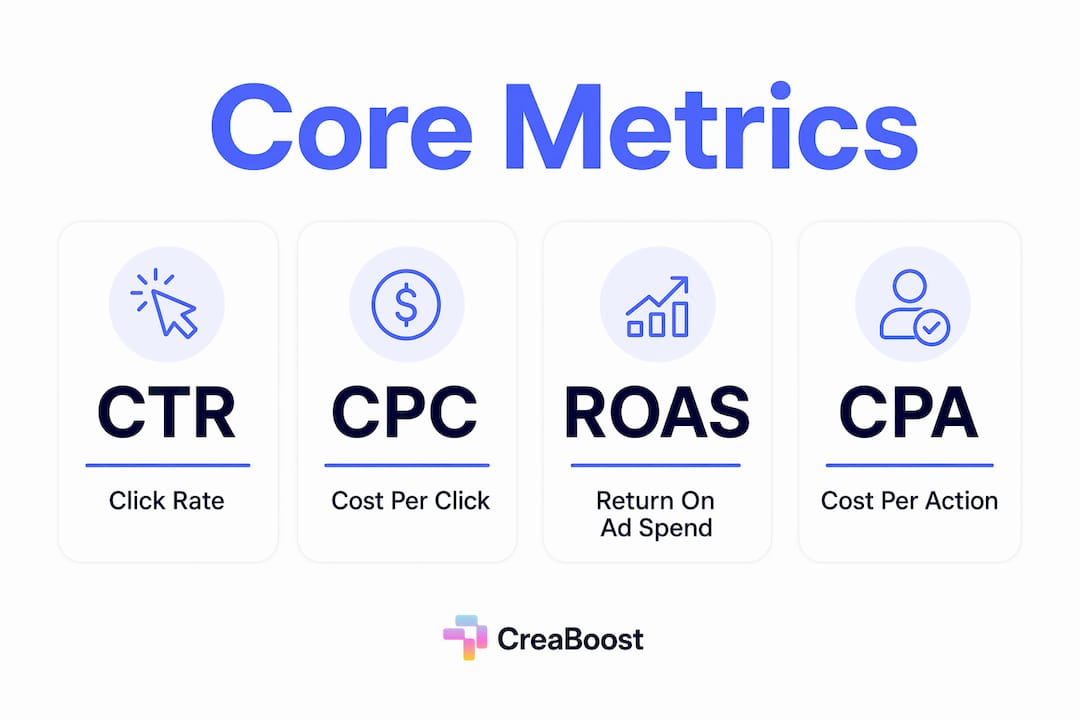
The five metrics that form the foundation of any ad performance review are CTR, CPC, conversion rate, ROAS, and CPA. Each answers a different diagnostic question.
- CTR measures whether your creative and targeting are generating interest. A low CTR on a broad audience usually points to a creative problem, not an audience problem.
- CPC reflects the cost efficiency of that interest. Rising CPC with stable CTR often signals auction competition or audience saturation.
- Conversion rate measures what happens after the click. A high CTR with a low conversion rate is a landing page problem, not an ad problem.
- ROAS connects ad spend directly to revenue. It is the metric most business owners care about most, and the one most easily distorted by attribution model choice.
- CPA tracks the cost of acquiring one customer or lead. It is the clearest signal for budget allocation decisions: monitor CTR, CPC, and conversion rate to decide which ads to pause, scale, or test.
Data for these metrics comes from multiple sources: ad platform dashboards (Meta Ads Manager, Google Ads), website analytics tools like Google Analytics 4, CRM platforms, and server-side tracking setups. The critical step is unifying these sources into a single view. When your ad platform data and your CRM data tell different stories about conversions, you have an attribution problem, not a performance problem. Recognizing that difference is what separates competent analysis from expensive confusion.
Pro Tip: Track only metrics that connect directly to a business goal. Impressions and reach are useful context, but they are not performance signals. Build your primary dashboard around CTR, CPA, and ROAS, and review vanity metrics separately.
How does a diagnostic workflow transform digital ad analysis?
Treating ad analysis as a diagnosis rather than a reporting task changes how you respond to performance changes. The six-step diagnostic routine below is the structure most high-performing teams use, whether they articulate it or not.
- Unify your data. Pull metrics from every relevant source into one view before drawing any conclusions. Fragmented data produces fragmented decisions.
- Define your success metrics. Decide before you look at results which metrics constitute a win for this specific campaign. Changing the definition after you see the numbers is how confirmation bias enters your analysis.
- Segment by campaign, audience, and creative. Never evaluate a campaign at the account level first. Drill down to the ad set and ad level to isolate where performance is strong or weak.
- Track trends over time. A single day of high CPA is noise. A seven-day trend of rising CPA is a signal. Always compare performance windows of equal length.
- Rank performers and identify outliers. Sort your ads by CPA or ROAS and look at the top and bottom 20%. The gap between your best and worst performers is your optimization opportunity.
- Form a hypothesis before making changes. This is the step most teams skip. Writing down what you believe is causing a performance shift before you act on it creates a learning record that compounds over time.
Common diagnoses that emerge from this process include creative fatigue (frequency rising, CTR falling), audience saturation (CPMs rising, reach plateauing), and attribution breaks (conversion counts dropping without a corresponding drop in actual sales). Before concluding that creative fatigue is the cause, isolate whether performance changes stem from attribution window drift or pixel failure. Measurement artifacts mimic real performance problems and lead to unnecessary creative refreshes.
Pro Tip: Document your hypotheses in a shared log before making any campaign changes. A simple spreadsheet with columns for date, hypothesis, action taken, and result creates a learning library that makes every future analysis faster and more accurate.
What role does attribution modeling play in digital advertising analysis?
Attribution is the process of assigning credit to touchpoints in a customer's journey leading to a conversion. The model you choose directly affects which channels look effective and which look wasteful, which means it directly affects where you allocate budget.
The table below compares the most common attribution models, their mechanics, and their appropriate use cases.
| Model | How it works | Best use case | Key limitation |
|---|---|---|---|
| Last-click | 100% credit to the final touchpoint | Direct response with short sales cycles | Ignores all upper-funnel activity |
| First-click | 100% credit to the first touchpoint | Brand awareness campaign evaluation | Ignores conversion-driving touchpoints |
| Linear | Equal credit across all touchpoints | Long sales cycles with many touches | Treats all touchpoints as equally valuable |
| Time-decay | More credit to touchpoints closer to conversion | Short-cycle e-commerce campaigns | Undervalues awareness and consideration channels |
| Data-driven | Machine learning distributes credit based on actual conversion paths | High-volume accounts with stable tracking | Requires significant conversion volume to be reliable |
Data-driven attribution detects causal impact by analyzing conversion paths at scale, including signals like email engagement that do not involve a direct click. This makes it the most accurate model available, but it comes with a data requirement. GA4's data-driven model requires roughly 300 conversions per month to produce stable outputs. Below that threshold, smaller businesses are better served by linear or time-decay models, which are simpler but more interpretable.
The deeper risk with attribution is treating platform-reported ROAS as ground truth. Attribution is a credit-assignment ledger, not a causal proof. Two channels can both claim credit for the same conversion. Combining attribution data with incrementality testing is the only reliable way to judge true impact before scaling spend.
How do MMM and incrementality analysis enhance ad insights?
Marketing Mix Modeling (MMM) and Multi-Touch Attribution (MTA) answer different questions and work best when used together rather than as substitutes. Understanding both is part of what makes digital marketing analytics mature.
MTA tracks individual user paths across digital touchpoints and assigns fractional credit to each interaction. It is granular and fast, making it useful for day-to-day optimization decisions. Its weakness is that it only captures trackable digital interactions and breaks down in cookie-restricted environments.
MMM takes a top-down statistical approach, using aggregate spend and revenue data across channels, including offline channels, to estimate the contribution of each. It captures long-term effects and cross-channel interactions that MTA misses entirely. Its weakness is that it requires months of historical data and does not update in real time.
The practical solution is reconciliation. MMM and MTA combined with incrementality methods provide calibrated insights that neither method delivers alone. Incrementality testing, typically run as a geo-based or holdout experiment, answers the question that both MMM and MTA avoid: would these conversions have happened anyway without the ad? That is the question that actually justifies budget decisions.
For most small and mid-size businesses, full MMM is not practical. The right entry point is running incrementality tests on your highest-spend channels once per quarter while using MTA for weekly optimization. Advanced measurement techniques like MMM add the most value when you are allocating significant budget across multiple channels and need to understand long-term brand effects alongside short-term conversion data.
What practical steps improve digital ad campaign effectiveness?
Knowing the theory of ad analysis only matters if you build a repeatable workflow around it. These are the steps that separate teams with consistent performance from teams that get lucky occasionally.
- Set a north star metric per campaign. Every campaign should have one primary success metric agreed upon before launch. For a direct-response campaign, that is CPA or ROAS. For a brand campaign, it might be CPM or video completion rate.
- Consolidate data before every review. Use UTM parameters consistently across every ad and every channel. Without clean UTM tagging, Google Analytics 4 cannot tell you which campaign drove which traffic, and your analysis is built on incomplete data.
- Run your diagnostic review on a fixed cadence. Weekly reviews catch creative fatigue and budget inefficiencies before they become expensive. Monthly reviews are too slow for paid social, where frequency above 2.5 combined with CTR drops signals audience saturation that needs immediate action.
- Test one variable at a time. When you change the creative, the audience, and the bid strategy simultaneously, you learn nothing. Structured A/B testing with a single variable per test is the only way to build reliable knowledge.
- Use tools built for the job. Google Analytics 4, Meta Ads Manager, and platforms like Creaboost each serve different parts of the analysis workflow. Creaboost's creative performance analytics layer sits on top of your ad account data and auto-tags creatives by format, hook, and concept, giving you the segmentation that manual analysis cannot scale.
Pro Tip: Maintain a creative performance log that records each ad's launch date, format, hook type, CTR, and CPA over time. This log, referenced in performance pattern research, helps you identify which creative concepts consistently outperform and shortens your briefing cycle on every future campaign.
Key takeaways
Effective digital ad analysis requires a diagnostic mindset, clean data, and the right attribution model for your conversion volume.
| Point | Details |
|---|---|
| Analysis beats reporting | Diagnosis-driven analysis identifies causes behind metrics, not just what changed. |
| Five core metrics | CTR, CPC, conversion rate, ROAS, and CPA form the foundation of every ad review. |
| Attribution model choice matters | Match your model to your data volume; use linear or time-decay below 300 conversions per month. |
| Hypothesis discipline | Document what you believe is causing a shift before making any campaign changes. |
| Advanced methods add precision | Combine MTA with incrementality testing to validate budget decisions at scale. |
The diagnostic habit most teams never build
Most teams I have observed treat ad analysis as something that happens after performance drops. The dashboard turns red, someone schedules a meeting, and the team spends two hours debating whether the creative is tired or the audience is saturated. By that point, the budget has been bleeding for a week or more.
The teams that consistently outperform their benchmarks do not wait for the red. They run a structured diagnostic review every week, document their hypotheses, and treat every campaign as an experiment with a defined learning objective. That discipline sounds simple, but it requires resisting the urge to make reactive changes based on two days of data.
Attribution complexity is the other place where I see teams get stuck. The right attribution model depends on your data volume, your sales cycle, and your business goals. There is no universal answer. What I have found is that most teams default to last-click because it is the platform default, not because it reflects their customer journey. That default quietly misallocates budget toward bottom-funnel channels and starves the upper-funnel activity that was generating demand in the first place.
The practical path forward is not to build a perfect measurement stack on day one. It is to start with clean UTM tagging, a fixed review cadence, and a hypothesis log. Those three habits alone will put you ahead of most advertisers running campaigns at similar scale.
— Bythewise
How Creaboost supports smarter ad analysis
If your team is already running the diagnostic workflow described above, Creaboost is the platform that removes the manual friction from every step.
Creaboost connects directly to your Meta Ads accounts and auto-tags every creative by format, hook, angle, and concept. That means the segmentation work that normally takes hours of manual spreadsheet work happens automatically. You see which creative concepts are driving ROAS at the cohort level, not just which individual ads got the most impressions. Creaboost also flags creative fatigue before it appears in your headline metrics, typically one to two weeks ahead of where the platforms would surface the signal. Explore the full creative analytics platform or get started at creaboost.com to see how it fits your current workflow.
FAQ
What is digital ad analysis in simple terms?
Digital ad analysis is the process of reviewing campaign data, including CTR, CPA, and ROAS, to understand what is working and what needs to change. It goes beyond reporting by diagnosing the causes behind performance shifts.
What metrics should I track to analyze digital ads?
The five core metrics are CTR, CPC, conversion rate, ROAS, and CPA. Track these at the ad and ad set level, not just the campaign level, to identify where performance is strong or weak.
How do I know which attribution model to use?
Match your model to your conversion volume and sales cycle. Accounts with fewer than 300 conversions per month should use linear or time-decay models. Higher-volume accounts can use data-driven attribution for more accurate credit assignment.
What is creative fatigue and how do I detect it?
Creative fatigue occurs when an audience has seen the same ad too many times, causing CTR to drop while frequency rises. A frequency above 2.5 combined with a declining CTR is a reliable signal that an ad needs to be refreshed or replaced.
How is MMM different from multi-touch attribution?
MMM uses aggregate spend and revenue data to estimate channel contribution over time, including offline effects. Multi-touch attribution tracks individual user paths across digital touchpoints. Both methods have blind spots, and combining them with incrementality testing produces the most reliable budget decisions.